
1. Global FX markets at a glance
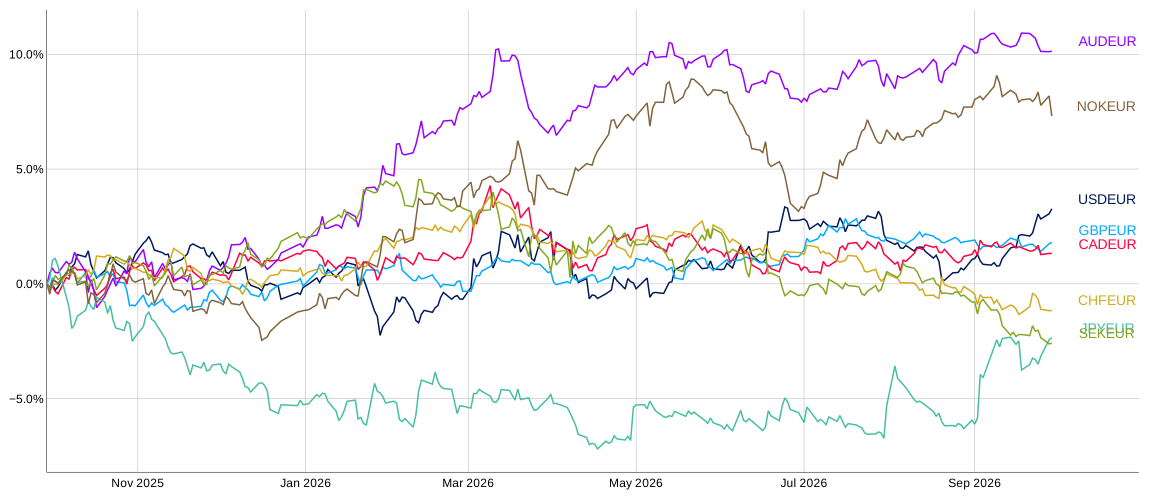
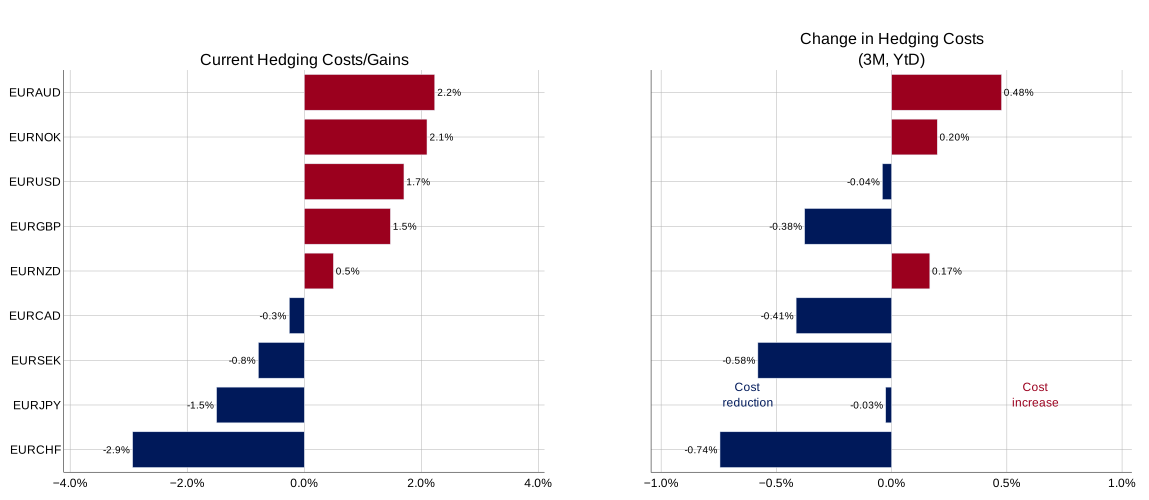
Figure1: Indexed exchange rates against the euro over the past 12 months (top chart), annualised hedging costs for a 3-month hedge (bottom left chart) and the 12-month change in the annualised 3-month hedge (bottom right chart)
(Source: Bloomberg, 7orca – own illustration)
Six months after the start of the Iran war, the blockade of the Strait of Hormuz remains a major factor for global commodity markets. The IEA counts the associated outages among the largest supply disruptions in the history of the oil market.
Under normal conditions, around one fifth of globally traded oil and a substantial share of Qatari LNG exports pass through the strait. The price of Brent crude at times rose well above USD 110 per barrel. Diplomatic signals from Oman brought temporary relief, but the oil price returned to triple-digit levels within a short time. At the same time, the market has so far priced in only a low probability of shipping traffic normalising fully by the end of the year.
Of particular relevance for the FX markets is that price pressure has now spread beyond the energy sector. Disrupted supply chains and higher transport costs have also affected other commodity groups. Industrial metals such as copper, aluminium and lithium have become more expensive since the start of the war. Prices for fertiliser precursors such as ammonia and urea, as well as for food, have also risen.
The Bloomberg Commodity Index is thus approaching the highs of 2022 again. The broad rise in commodity prices affects the terms of trade of individual economies in different ways. Commodity-exporting countries generally benefit from higher export prices, while commodity-importing economies are confronted with rising import costs. There, higher commodity prices can raise inflation via production costs and consumer prices while weighing on economic activity at the same time.
These differences are also evident in the G10 FX market. Commodity currencies such as the Australian dollar and the Norwegian krone are among the stronger currencies against the euro in a year-on-year comparison (see Figure 1, top chart).
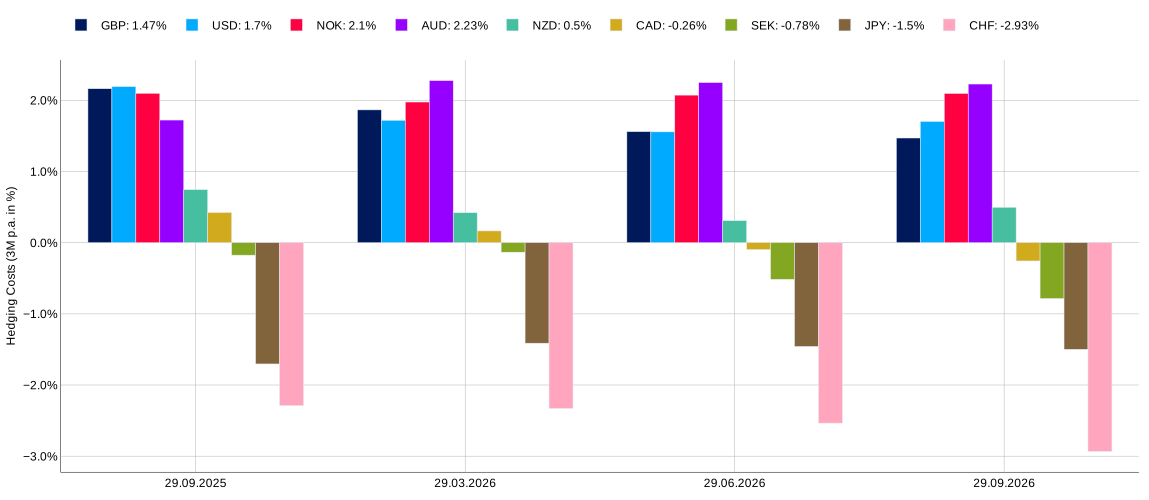
Norges Bank has raised the policy rate to 4.50%. The Reserve Bank of Australia has also tightened its monetary policy over the course of the year. In both economies, higher commodity prices improve the terms of trade and can raise domestic price pressure at the same time. The resulting interest rate differentials are also reflected in high hedging costs for EUR/AUD and EUR/NOK.
At the other end of the hedging cost spectrum is EUR/CHF. At around -2.9%, the hedging return is at a level last reached before the global financial crisis (2008).
EUR/JPY follows at around -1.5% (see Figure 1, bottom left chart). For commodity-importing economies such as the eurozone and Japan, by contrast, the broad rise in commodity prices represents a negative supply shock that weighs on purchasing power, raises production costs and reinforces inflationary pressure at the same time.
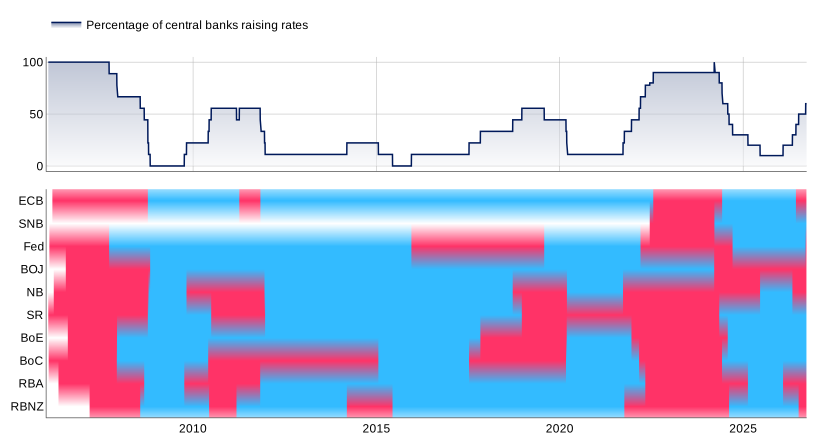
Figure 2: Central bank activity; the red area marks the start of a rate increase (including the subsequent period in which rates are held constant) and blue represents the start of a rate cut (likewise including the subsequent period in which rates are held constant)
(Source: Bloomberg, 7orca – own illustration and calculations)
Monetary policy developments within the G10 have changed accordingly (see Figure 2). The rate-cutting cycle observed since 2024 has been interrupted by the renewed rise in inflation. More than half of the G10 central banks have recently raised their policy rates again. A comparable degree of synchronisation was last observed during the global monetary tightening cycle of 2022/23.
The Fed raised the policy rate by 25 basis points in September to 3.75% to 4.00%. Robust US domestic demand and persistently elevated underlying price pressure give the Fed scope for a more restrictive monetary policy.
The ECB also raised the deposit rate to 2.50% in September. The starting position, however, differs from that in the US. In the eurozone, the recent rise in inflation is driven more strongly by higher energy prices, while the economic environment is weaker.
The conditions for the further course of monetary policy at the Fed and the ECB therefore differ. The robust US economy and the more domestically driven inflationary pressure argue for US interest rates remaining elevated for longer. In the eurozone, by contrast, weaker growth and the more external nature of the inflation shock limit the scope for prolonged tightening. These differences remain an important factor for the development of exchange rates and hedging costs.
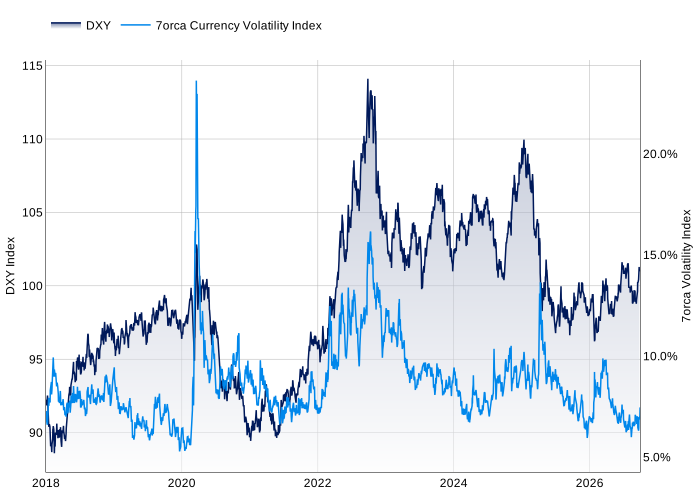
Figure 3: US Dollar Index (DXY) vs. 7orca FX Volatility Index1
(Source: Bloomberg, 7orca – own illustration and calculations)
1The 7orca FX Volatility Index approximates the ‘fair’ value of a variance swap by replicating a plain vanilla options portfolio in the G10 currency market. The resulting indices are averaged. A higher value is to be interpreted as higher fluctuations in the FX market.
The US Dollar Index (DXY) shows a recovery this year from the previous year’s lows. In the course of the escalation in the Middle East, the US dollar was initially supported by higher demand for liquid assets perceived as comparatively safe. At the same time, monetary policy expectations in the US have changed. After a period of weakness over the summer, the rate increase in September and robust US economic data have recently lent stronger support to the US dollar again (see Figure 3).
At the same time, the low volatility in the FX market remains striking. Despite the geopolitical uncertainty, the 7orca FX Volatility Index continues to move at a level that is low by historical standards. The rises in volatility observed since the start of the Iran war were each short-lived. The FX market has thus so far reacted much less strongly to the conflict than the commodity markets.
The combination of persistent risks to energy supply and low FX volatility nevertheless remains remarkable. A renewed escalation or prolonged disruptions to shipping traffic could lead to stronger movements in the FX markets again, in particular via commodity prices, inflation expectations and the resulting monetary policy responses.
2. Europe and the US
‘We must be confident that underlying inflation is moving to our objective, clearly and at sufficient speed.’ Kevin Warsh (28.08.2026)
2.1 Monetary policy & exchange rate developments
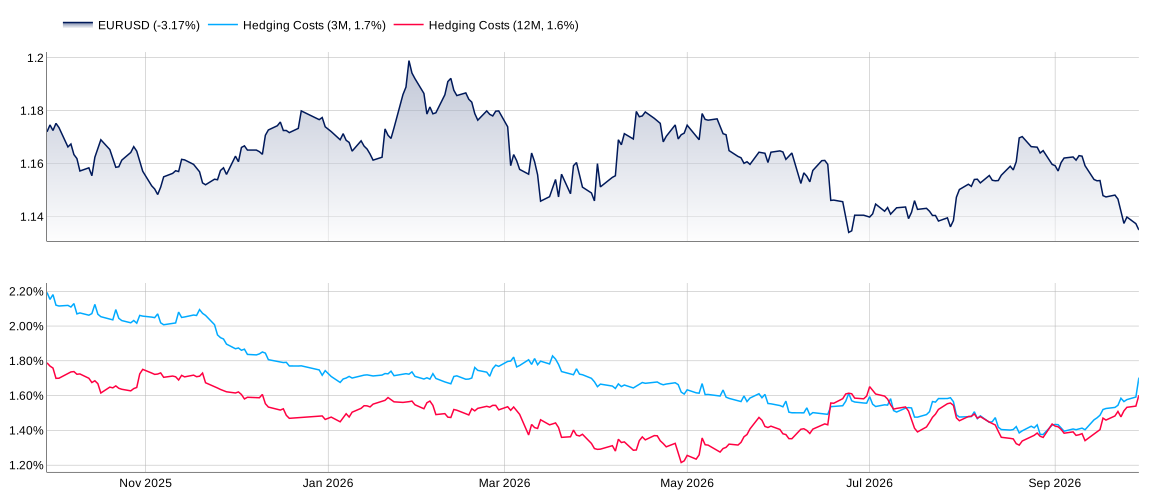
Figure 4: EUR/USD exchange rate and hedging costs
(Source: Bloomberg, 7orca – own illustration)
The USD appreciated noticeably in the reporting quarter and was most recently trading in the region of 1.13. Compared with the spring lows for the year, this corresponds to an appreciation of a good 4% and confirms the downside risks for the euro identified in the previous quarter (see Figure 4, top chart).
Hedging costs over three and twelve months have converged to around 1.7% to 1.6% and are now almost level. The previous difference between the two tenors, which reflected differing interest rate expectations over time, has thus largely disappeared.
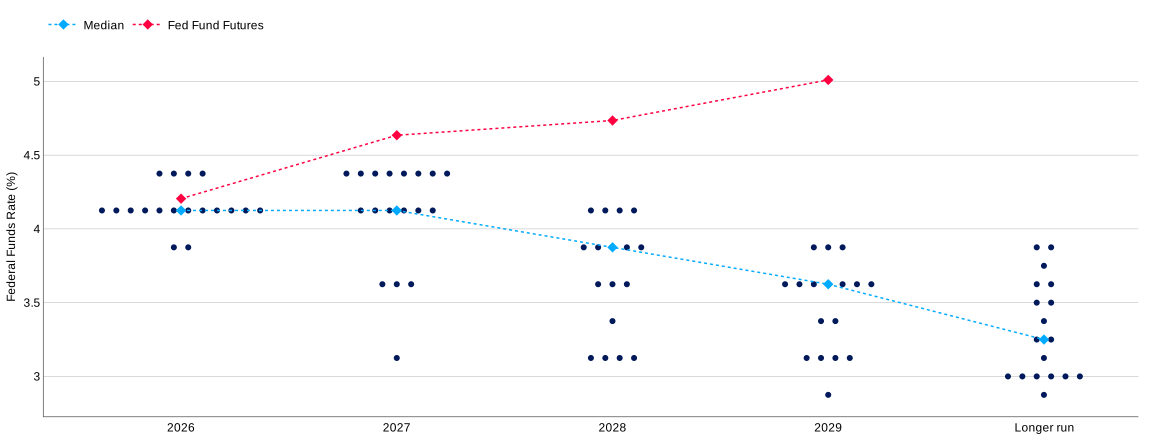
Figure 5: Dot plots from the Fed’s Summary of Economic Projections.
(Source: Fed, Bloomberg, 7orca – own illustration)
The Fed’s September decision to raise the policy rate unanimously by 25 basis points to 3.75% to 4.00%, and the ‘hawkish’ signals from the meeting of leading central bankers in Jackson Hole, have strengthened the credibility of the new monetary policy framework under Warsh. The updated dot plots (the interest rate projections of the US central bankers) likewise confirm the picture of a central bank with a clear and internally largely aligned monetary policy stance (see Figure 5). For 2026, the projections of the FOMC members lie closely together at around 4.0% to 4.25%. The dissent within the FOMC that was still clearly visible in July has thus narrowed noticeably.
At the same time, there is a marked difference between the Fed’s projections and market expectations. For 2027 and 2028, Fed Funds Futures are pricing in a higher rate path than the median of the FOMC projections. The market expects interest rates to remain elevated for longer than the Fed’s projections currently suggest. This may reflect both more robust growth and inflation expectations and a higher risk premium for the future rate path. The Fed’s decision not to provide explicit forward guidance reinforces this uncertainty. Market participants must assess the further rate path more on their own and price in the corresponding risks.
These changed interest rate expectations are clearly reflected in the US bond market. At the end of September, the yield on ten-year US Treasuries rose above 5% for the first time since 2007. Following the release of the September PMI data, it also recorded its largest daily increase in more than a year and a half. Yields are now high across the entire maturity spectrum: two-year US Treasuries yield just under 5%, while the yield on 30-year bonds is well above that level.
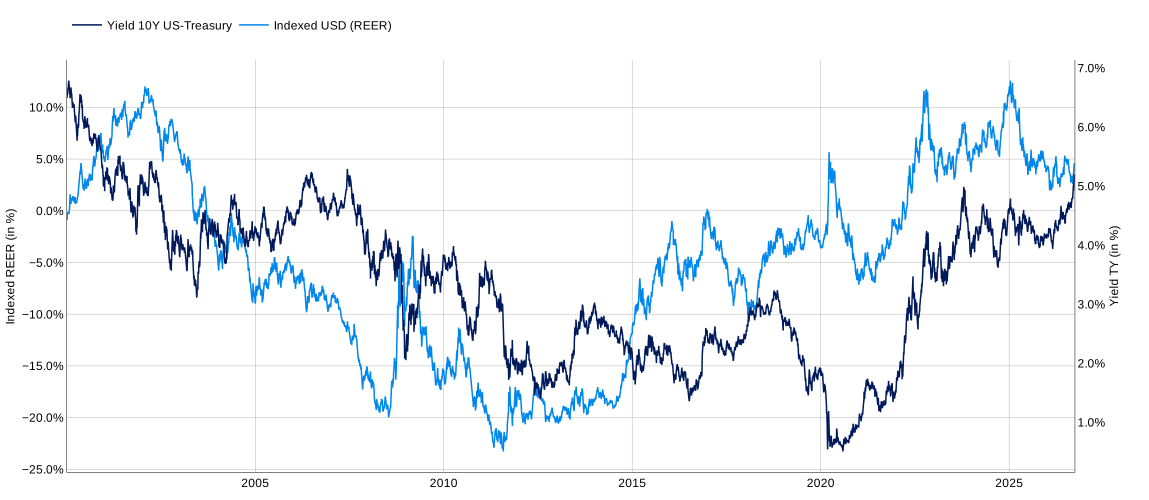
Figure 6 shows, however, that the US dollar has so far reacted comparatively weakly to this rise in yields. Although the historically positive relationship between US yields and the real effective exchange rate is discernible again, the appreciation of the US dollar lags well behind the rise in yields. For the further development of the US dollar, the key question is therefore which factors lie behind the rise in yields and to what extent they also support the US dollar.
Figure 6: Yield on 10-year US Treasuries (TY) vs. USD Real Effective Exchange Rate (REER)
(Source: Bloomberg, 7orca – own illustration)
The rise in yields has several causes. First, growth expectations have improved. The US economy continues to surprise on the upside, so the market is pricing in more robust nominal growth momentum. This is fundamentally supportive for the US dollar. Second, inflation expectations have risen. Higher energy prices and persistently high core inflation argue for interest rates remaining elevated for longer and thus also support the US dollar.
The third factor lies on the supply side. In view of structurally high budget deficits, the US Treasury is increasingly financing itself through short-dated money market instruments. As a result, the share of Treasury bills in outstanding debt has risen to over 20%, well above historical comparative levels. While the high share of short-dated government debt reduces the funding requirement at longer maturities in the short term, it increases future refinancing needs and interest rate sensitivity. Combined with structurally high budget deficits, this raises uncertainty about the medium-term supply of longer-dated government bonds, which can contribute to a higher term premium. This effect is reinforced by the continued reduction of the Fed’s balance sheet, as maturing securities are not fully reinvested and a larger share of the bond supply therefore has to be absorbed by the private market.
Additional supply pressure comes from the corporate bond market. Issuance of investment-grade bonds is running at record levels. A major driver is the AI-related investment boom, particularly in data centres, energy infrastructure and semiconductor capacity. Companies are financing a growing share of these investments via the bond market. The additional supply of longer-dated bonds therefore meets a market that already has to absorb a high volume of government issuance. This, too, contributes to higher term premiums at the long end.
This supply pressure also offers a possible explanation for the decoupling of US yields and the US dollar visible in Figure 6. Not every rise in yields is equally positive for the dollar. If yields rise on the back of better growth prospects or higher policy rate expectations, this tends to increase the attractiveness of US dollar assets. If, on the other hand, the rise in yields is driven primarily by higher bond supply and rising term premiums, the positive effect on the US dollar is considerably smaller.
For EUR/USD, it follows that higher US yields fundamentally continue to favour the US dollar. However, the magnitude of the rise in yields may overstate the resulting impulse for the currency. What matters is why yields are rising: if robust growth and a restrictive Fed course maintained for longer are the main drivers, this should support the US dollar more strongly. If, on the other hand, the rise is due primarily to higher bond supply and rising term premiums, the positive effect on the US dollar will be smaller.
The weak reaction of the US dollar to the rise in yields so far suggests that the market does not interpret at least part of the movement at the long end as a classic monetary policy impulse. For the further development of EUR/USD, the composition of the rise in yields is therefore more decisive than the absolute level of yields.
2.2 Economic activity
Economic developments in the US and the eurozone remain divergent. Although the pure growth differential has narrowed compared with the beginning of the year, the drivers of growth continue to differ markedly.
The US economy is proving robust. In its September projections (Summary of Economic Projections, SEP), the Fed raised its growth forecast for 2026 from 2.2% to 2.3% and for 2027 to 2.4%. At the same time, a clear majority of FOMC members continue to see considerable inflation risks, while the projection for the unemployment rate was revised downwards again. Despite the elevated level of interest rates, the economic expansion is thus continuing. It is supported by robust private consumption, fiscal stimulus and high investment related to the build-out of AI infrastructure.
The eurozone has also recently performed better than expected. Real GDP rose by 0.6% quarter on quarter in the second quarter of 2026, after growth of 0.4% had initially been reported. Year on year, growth amounted to 1.2%. The development was supported in particular by higher exports and fiscal stimulus. The ECB’s September projections assume growth of around 1.2% for 2026 as a whole. Over the medium term, lower energy prices and rising real incomes are expected to provide additional support for economic activity. Within the eurozone, however, differences remain considerable. Spain again recorded strong quarterly growth of 0.7%. Germany is showing initial signs of a recovery, while corporate investment remains subdued despite better export performance.
The growth differential between the US and the eurozone is thus smaller than at the beginning of the year. The composition of growth, however, continues to differ. In the US, the expansion is carried by private consumption and investment, while the recovery in the eurozone depends more strongly on exports, fiscal stimulus and the development of real incomes.
For EUR/USD, this divergence remains relevant because it supports different monetary policy conditions. The robust US economy gives the Fed more scope for a restrictive monetary policy despite persistently elevated inflation risks. In the eurozone, by contrast, the weaker growth environment limits the ECB’s monetary policy scope. Relative growth and interest rate developments therefore remain a supportive factor for the US dollar for the time being.
2.3 Price developments
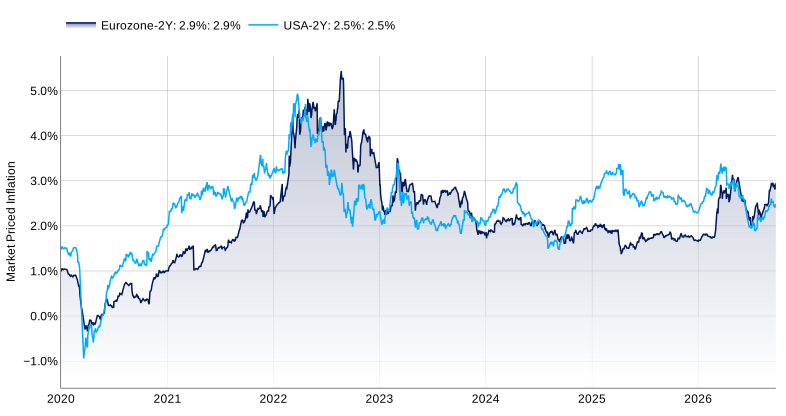
Market-based inflation expectations over a two-year horizon have recently converged again in the US and the eurozone (see Figure 7). Behind the similar level, however, lie different inflation drivers.
In the US, headline inflation stands at around 3.4%, while core inflation is 2.4%. The development of individual components shows, however, that underlying price pressure remains elevated. In particular, services inflation excluding housing costs, often referred to as ‘supercore’ inflation, has recently picked up again and is running well above the 2% target on an annualised basis. Unlike an energy-driven inflation surge, this price pressure is more domestically driven. Robust real wages, a labour market that remains comparatively tight and solid domestic demand contribute to it. Additional demand impulses come from the high level of investment in AI infrastructure. For the Fed, this composition of inflation suggests that price pressure is likely to ease only slowly and that a restrictive level of interest rates remains necessary.
Figure 7: Market-priced inflation rates in the US and the eurozone (2-year horizon)
(Source: Bloomberg)
In the eurozone, by contrast, the recent inflation development is driven more strongly by energy prices. Headline HICP inflation rose to 3.3% in August, with the increase largely attributable to energy prices, which rose by more than 14% year on year. Core inflation, on the other hand, declined slightly, pointing to lower domestic price pressure.
The high dependence on energy imports makes the eurozone particularly vulnerable to external price shocks. Around 55% of primary energy requirements are imported, with the dependence in Germany even higher. Rising prices for crude oil and natural gas therefore have a comparatively strong impact on the cost base of European industry. As a net energy exporter, the US is much less affected by this effect.
These differences are also evident in German producer prices. In August 2026, they were 4.6% above the previous year’s level, after having fallen by 3.3% in February. The increase was particularly pronounced for energy-intensive components: petroleum products rose by more than 40% year on year, light heating oil by more than 65%. Producer prices for services also rose by 3.7% year on year in the second quarter. The rapid rise in producer prices illustrates how strongly higher energy prices can affect the cost base of the German economy.
This results in different starting positions for monetary policy. In the US, persistently elevated domestic price pressure coincides with a robust economy. This gives the Fed more scope to keep interest rates restrictive for longer. In the eurozone, by contrast, the recent rise in inflation is attributable more to external energy prices, while domestic price pressure and growth are weaker. For the ECB, this creates a more difficult trade-off between fighting inflation and the burden on economic activity.
Should energy price pressure ease again in line with the assumptions of the ECB projections, the pressure on the ECB for further rate increases is also likely to diminish. For EUR/USD, the differing composition of inflation therefore remains the key factor: persistent domestic price pressure in the US tends to argue for US interest rates remaining elevated for longer, while a temporary, energy-driven rise in inflation in the eurozone argues less clearly for a lastingly more restrictive ECB monetary policy. This would continue to influence relative interest rate developments in favour of the US dollar.
2.4 Overall assessment of EUR/USD
The fundamental conditions continue to argue for relative support for the US dollar. The robust US economy and persistent domestic price pressure give the Fed scope to keep interest rates restrictive for longer. The ECB, by contrast, faces a weaker growth environment and a rise in inflation that is driven more strongly by external energy prices. Should energy price pressure ease, the pressure for further rate increases in the eurozone is likely to diminish accordingly.
The higher level of yields in the US bond market also fundamentally supports the US dollar. However, the strength of this effect depends on the causes of the rise in yields. Insofar as higher yields are attributable to robust growth and a restrictive Fed course maintained for longer, they favour the US dollar. The part of the rise in yields that is due to higher bond supply and rising term premiums, on the other hand, is likely to provide a smaller positive impulse for the currency.
Overall, the appreciation potential for the US dollar therefore remains intact. In the short term, the interest rate differential and the robust US growth environment in particular favour the US dollar. Over the medium term, the decisive question remains whether the differences in growth, inflation and the resulting monetary policy responses of the Fed and the ECB persist.
3. United Kingdom
3.1 Monetary policy & exchange rate developments
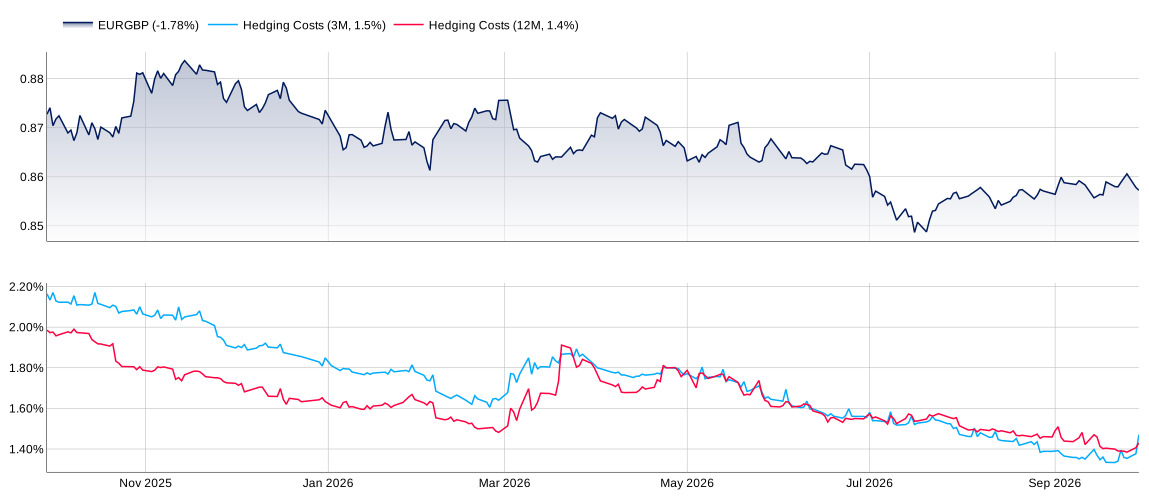
Figure 8: EUR/GBP exchange rate and hedging costs
(Source: Bloomberg)
The British pound appreciated slightly against the euro in the reporting quarter. The EUR/GBP exchange rate fell from around 0.88 to below 0.85 at times, reaching a level last observed over an extended period before the Brexit referendum. The appreciation of the pound is attributable less to pronounced economic strength in the United Kingdom than to the relative weakness of the euro. At the same time, the UK growth environment continues to compare favourably with the eurozone.
Hedging costs have also fallen significantly over the course of the year. Over both three and twelve months, they declined from over 2% to around 1.4% most recently and are now almost level (see Figure 8, bottom chart). The previous difference between the two tenors, which reflected differing interest rate expectations over time, has thus largely disappeared. For investors with hedging requirements, hedging pound positions has accordingly become significantly cheaper over the course of the year.
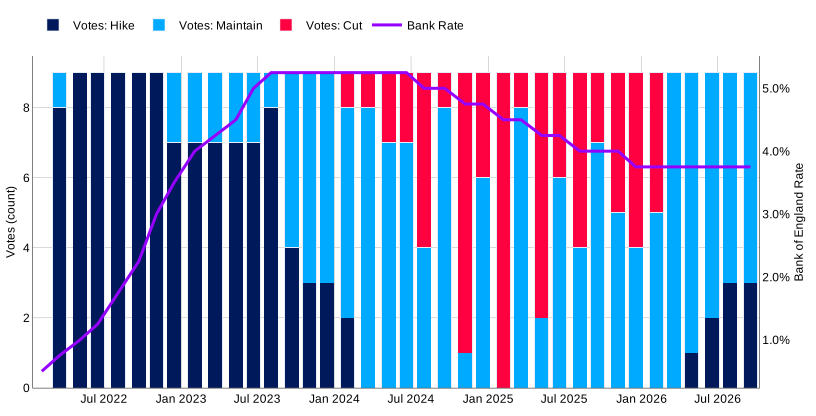
Within the Bank of England, too, the differing assessments of the further course of monetary policy have recently intensified (see Figure 9). On 17 September, the BoE left the policy rate at 3.75%, as expected. It was the sixth consecutive hold since the rate cut in December 2025. In the Monetary Policy Committee (MPC), the BoE’s decision-making body responsible for monetary policy, six members voted for unchanged rates, while three members favoured an immediate increase to 4.0%.
The BoE thus faces a similar trade-off to the ECB. Higher energy prices raise inflationary pressure in the short term, while the weak domestic economy limits the scope for a lastingly more restrictive monetary policy. Should energy price pressure persist and consumer price inflation continue to rise, this would increase the pressure on the BoE to raise interest rates again. At the same time, the weak growth environment argues against a pronounced or prolonged rate-hiking cycle.
Figure 9: Voting pattern of the Bank of England
(Source: Bank of England)
3.2 Economic activity
UK GDP grew by 0.4% quarter on quarter in the second quarter of 2026, continuing to develop moderately positively. The expansion also continued in July with monthly growth of 0.4%. It was driven primarily by the services sector, while industrial production declined. Both manufacturing and industry as a whole recorded declines in output.
Signals from the labour market are also becoming increasingly weak. The number of job vacancies fell to its lowest level in more than five years. At the same time, wage growth has slowed to around 3.6% most recently and, according to the BoE’s business surveys, is likely to ease further. The domestic economy is thus less robust than the GDP figures initially suggest. Investment activity remains subdued, while higher energy prices weigh on both production costs and the purchasing power of private households. At the same time, the BoE expects inflation to rise to around 3.2% in the fourth quarter of 2026. The scope for monetary easing therefore remains limited.
Compared with the eurozone, however, the United Kingdom is less dependent on energy imports. More than 40% of oil and gas requirements are covered by imports, as production in the North Sea no longer fully covers domestic demand. In the eurozone, import dependence for primary energy requirements is higher at around 57%. Rising world market prices therefore also hit the UK economy, but the effect tends to be smaller than in the eurozone. Nevertheless, the rise in UK input prices of more than 6% year on year in August shows that cost pressure is considerable.
At the same time, the United Kingdom does not benefit from higher energy prices to the same extent as a net energy exporter. The rise in energy prices therefore continues to represent a burden on growth and inflation, albeit to a lesser extent than in the more import-dependent economies of the eurozone. For the BoE, this results in a similar but less pronounced trade-off to that facing the ECB: external price pressure argues against rapid monetary easing, while the weaker domestic economy limits the scope for further rate increases.
3.3 Price developments
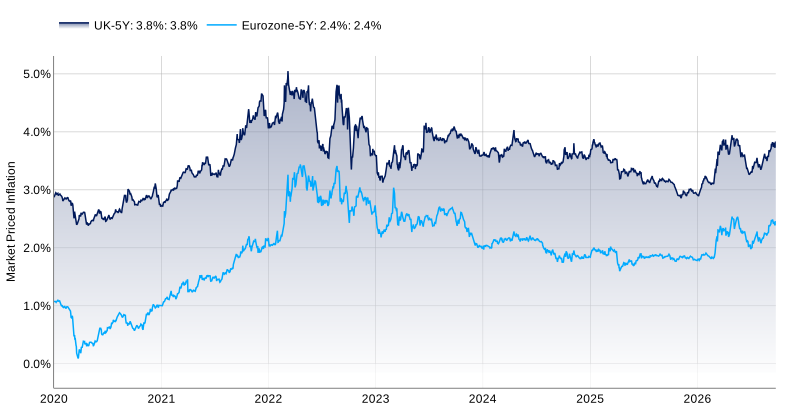
Persistent inflationary pressure remains a key factor for the Bank of England’s monetary policy and thus also for the British pound (see Figure 10). At around 3.8%, market-based inflation expectations over a five-year horizon remain well above the BoE’s inflation target and at the same time above the eurozone level of around 2.4%. This gap became further entrenched in the reporting quarter.
Current price developments also point to persistent inflationary pressure. The consumer price index (CPI) rose by 3.1% year on year in August, after 2.9% in July. Higher fuel prices were the main driver. At the upstream level, price pressure is even more pronounced: producer input prices were 6.1% above the previous year’s level in August, while factory gate prices rose by 3.7%. This indicates that part of the higher cost pressure has not yet been fully passed on to consumers.
At 2.6%, core inflation is also above the inflation target. Services prices in particular contribute to this. They are determined more strongly by domestic factors and generally recede more slowly than energy-driven inflation impulses. Although the BoE has so far not identified pronounced second-round effects, the persistently elevated inflation expectations of private households and the only slowly easing core inflation argue against a rapid normalisation of price pressure.
For the BoE, this results in limited monetary policy scope. Persistent inflationary pressure argues against rapid easing, while moderate growth momentum at the same time leaves little room for significantly higher interest rates. For the pound, this constellation is two-sided: UK interest rates remaining elevated for longer can support the currency relative to the euro, while the weak growth environment stands in the way of a stronger fundamental appreciation.
Figure 10: Market-based inflation rates in the UK and the eurozone (5-year horizon)
(Source: Bloomberg)
3.4 Overall assessment of EUR/GBP
The recent appreciation of the pound against the euro is less an expression of pronounced fundamental strength in the United Kingdom than of relative support against the euro. The economic starting positions are similar in key respects: both the BoE and the ECB face elevated external price pressure combined with a moderate domestic economy.
A key difference lies in the development of inflation. In the United Kingdom, underlying price pressure is more persistent, so the BoE’s scope for monetary easing remains smaller. This results in a relative interest rate advantage over the eurozone that can continue to support the pound. The reduced but still positive hedging costs reflect this difference.
At the same time, the UK economy lacks the pronounced growth momentum that would justify a stronger fundamental appreciation of the pound. For the EUR/GBP exchange rate, this results in a balanced picture with a moderate advantage for the pound. A stronger appreciation of the euro would require an improvement in the eurozone’s relative growth and interest rate prospects.
4. Japan
4.1 Monetary policy & exchange rate developments
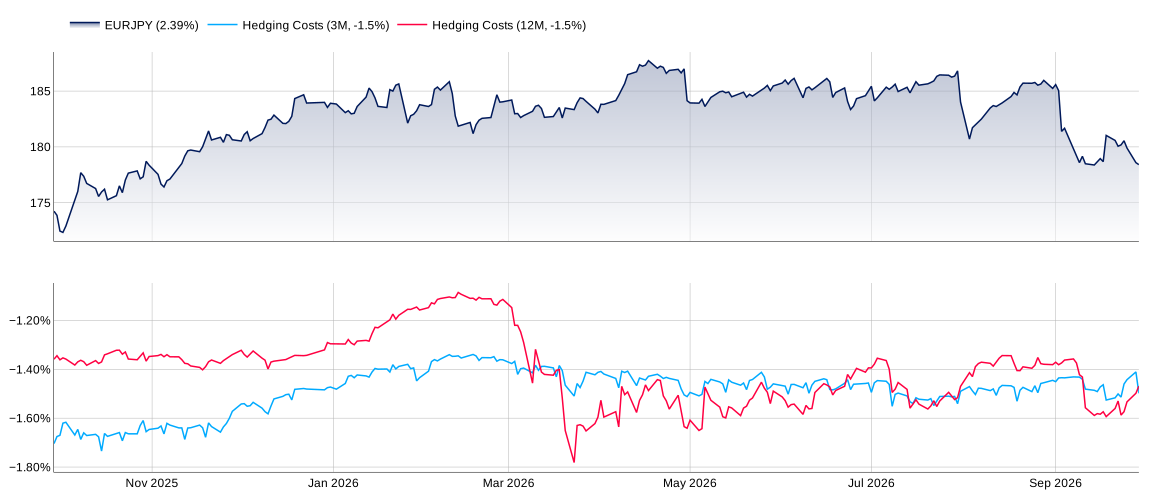
Figure 11: EUR/JPY exchange rate and hedging costs
(Source: Bloomberg, 7orca – own illustration)
The yen appreciated significantly at times in the reporting quarter. The move, however, is attributable less to pronounced strength in the yen than to the weakness of the euro and a persistent intervention strategy on the part of the BoJ (see Figure 11, top chart). Despite the decline, EUR/JPY continues to trade at a historically high level, reflecting the depreciation of the yen against the euro accumulated over several years.
The most important monetary policy event of the quarter was the BoJ’s September meeting. By a vote of seven to two, it raised the policy rate by 25 basis points to 1.25%, the highest level since 1995. Governor Ueda held out the prospect of further rate increases, if growth and inflation develop in line with the BoJ’s projections. Market expectations also point to a continuation of monetary policy normalisation and price in a policy rate of around 1.75% by mid-2027.
The rate increase was preceded at the end of July by a coordinated intervention by Japan and the US in the FX market. USD/JPY subsequently fell by more than 3% within a few hours and at times below the 160 yen per US dollar mark. The effect on the exchange rate, however, was short-lived. In the two following weeks, Japanese investors bought a net total of more than JPY 5 trillion in foreign equities and bonds, using the stronger yen to build up foreign positions.
The development illustrates the limits of FX market interventions as long as large international interest rate differentials persist. Interventions can influence the exchange rate in the short term, but they do not change the underlying yield differentials between Japan and other currency areas. Despite the normalisation of monetary policy that has begun, interest rates in Japan remain well below those in the eurozone and the US. This has so far limited support for the yen.
Hedging costs also reflect this interest rate differential (see Figure 11, bottom chart). At around -1.5% over three months and -1.6% over twelve months, hedging yen positions against the euro continues to generate a positive hedging return. The almost parallel levels of both tenors also show that the market is pricing in only a limited change in the interest rate differential over this horizon.
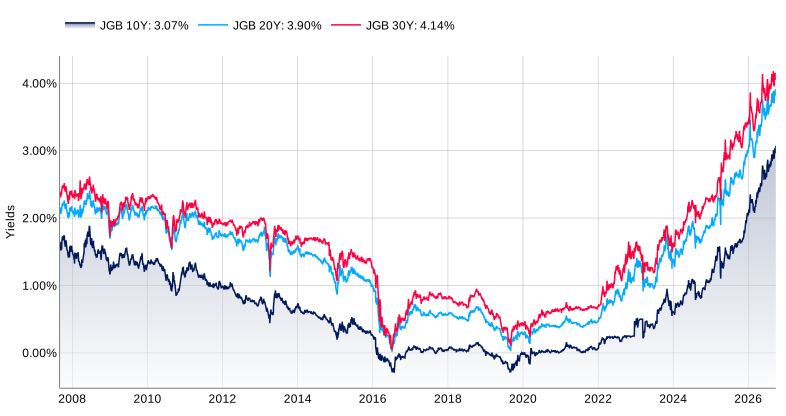
Monetary policy normalisation is also clearly visible in the Japanese government bond market (see Figure 12). The yield on ten-year government bonds stands at 3.07%, almost 40 basis points above the level of the previous quarter. At the same time, 20-year bonds yield 3.90% and 30-year bonds 4.14%. The significantly higher yields at the long end suggest that, in addition to expectations regarding the future policy rate path, longer-term risk and term premiums also play an important role. The high level of government debt limits the scope for rapid monetary policy normalisation. With gross debt of more than 200% of GDP, higher interest rates lead successively to rising refinancing costs for the Japanese state. The BoJ therefore faces the task of normalising its monetary policy without creating additional burdens for the economy and public finances through an excessively rapid rise in interest rates.
For the yen, therefore, what matters is not only that Japanese yields are rising, but what is causing the rise. Higher yields can support the yen if they reflect sustainable monetary policy normalisation and narrower interest rate differentials vis-à-vis other countries. If, on the other hand, long-term yields in particular rise as a result of higher term or fiscal risk premiums, the positive effect on the yen is much less clear-cut.
Figure 12: Yield curve in Japan
(Source: Bloomberg)
4.2 Economic activity
The Japanese economy grew moderately in the second quarter of 2026 but fell short of expectations. Real GDP rose by an annualised 1.1%, after 1.8% in the first quarter and against market expectations of 2.0%. Quarter on quarter, growth amounted to 0.3%.
Positive growth contributions came primarily from foreign trade. Exports were supported by the weak yen and higher global demand for semiconductor equipment in the course of the AI investment boom. At the same time, imports declined, which increased net exports and thus, arithmetically, GDP. This effect should not, however, be interpreted as a sign of a stronger economy, as the decline in imports was partly attributable to supply bottlenecks related to the blockade of the Strait of Hormuz. Private consumption, on the other hand, remained subdued, so domestic demand continues to provide only limited growth impulses.
For the third quarter, leading research institutes expect a further slowdown to annualised growth of around 0.7%. At the same time, the labour market remains tight, supporting wage growth. This development is of particular importance for the BoJ, as rising wages are a prerequisite for inflation becoming more firmly anchored domestically on a lasting basis and for monetary policy normalisation to continue.
Higher energy import costs remain a major burden. Japan is highly dependent on energy imports and sources a large share of its crude oil imports from the Middle East. The effects of the conflict in the region therefore hit the Japanese economy both through higher world market prices and through risks to energy supply and transport routes. The blockade of the Strait of Hormuz adds to this burden and can lead to higher production costs and supply chain constraints, particularly for energy-intensive companies.
The economic environment for the BoJ thus remains challenging. The tight labour market and wage growth fundamentally argue for a continuation of monetary policy normalisation. At the same time, moderate domestic demand and the burden of higher energy prices limit the scope for rapid rate increases.
4.3 Price developments
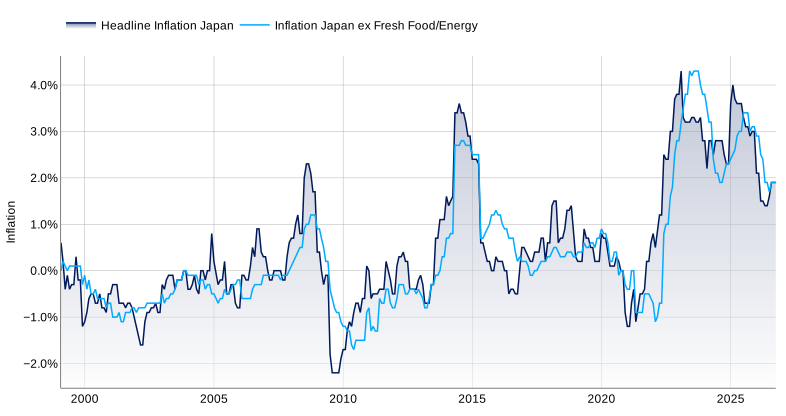
The development of inflation in Japan increasingly points to a more sustainable normalisation of the price environment (see Figure 13). Headline inflation stood at 1.9% year on year in August, unchanged from the previous month. Underlying price pressure has also increased. Core inflation excluding food rose to 1.8% in July, while the price index excluding fresh food and energy, which the BoJ pays particular attention to, reached 1.9%. Several inflation measures are thus now close to the central bank’s 2% target.
Figure 13: Inflation and core inflation in Japan
(Source: Bloomberg)
For the BoJ, the composition of inflation is particularly relevant. After a long period of very low price increases, headline and core inflation are now close to the inflation target. At the same time, government energy subsidies are dampening the rise in consumer prices, so underlying price pressure is in part higher than headline inflation suggests.
Decisive for further monetary policy normalisation is whether inflation stabilises sustainably around the 2% target independently of external price impulses. Rising wages and a stronger pass-through of higher costs by companies in particular argue for this. If this development continues, it would support the BoJ’s assessment that a more stable relationship between wages and prices is becoming established. This would at the same time strengthen the basis for a further gradual normalisation of monetary policy.
4.4 Overall assessment of EUR/JPY
The analysis yields an overall consistent picture. The BoJ is continuing monetary policy normalisation, but the scope for a marked acceleration of the rate-hiking path remains limited in view of moderate domestic demand and the high interest rate sensitivity of the Japanese economy. At the same time, the higher yields at the long end reflect not only expectations of further monetary policy normalisation but also rising term and risk premiums. The rise in yields can therefore be interpreted only in part as a positive signal for the yen.
For EUR/JPY, the still substantial interest rate differential between Japan and the eurozone remains the key factor. Despite the BoJ’s rate increases, hedging euro positions against the yen continues to offer a positive hedging return. Continued normalisation of Japanese monetary policy could gradually reduce this advantage, but a rapid convergence of interest rate levels is not to be expected under current conditions.
Monetary policy normalisation and the increasingly domestically driven inflation thus fundamentally argue for stronger support for the yen than in recent years. The still large interest rate differential and the limited scope for rapid rate increases, however, work against this. For EUR/JPY, this results in a less one-sided picture than in previous years, while the positive hedging return remains in place for the time being.
5. Data overview
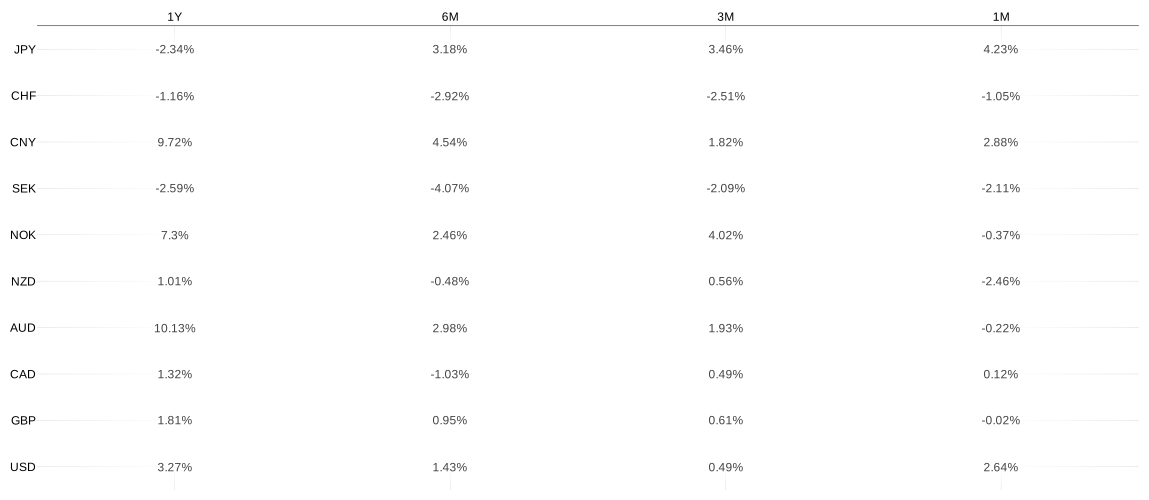
Figure 14: Overview of performance against the euro on various reference dates
(Source: Bloomberg, 7orca – own illustration)
Figure 15: Overview of the development of hedging costs against the euro at various reference dates
(Source: Bloomberg, 7orca – own illustration)
Source and data set for all information, unless otherwise stated: 7orca Asset Management AG (30 September 2026)

